Analytics
The Analytics feature delivers invaluable realtime insights, offering a comprehensive overview of key metrics crucial for evaluating link performance and reach. Within Y.gy, users gain access to detailed analytics tailored to individual links, as well as broader organizational analytics covering all links affiliated with the organization.
Individual Link Analytics
You can access analytics of a particular link by clicking on your desired link through the "All Links" Dashboard and then Navigating to the "Analytics" Tab.
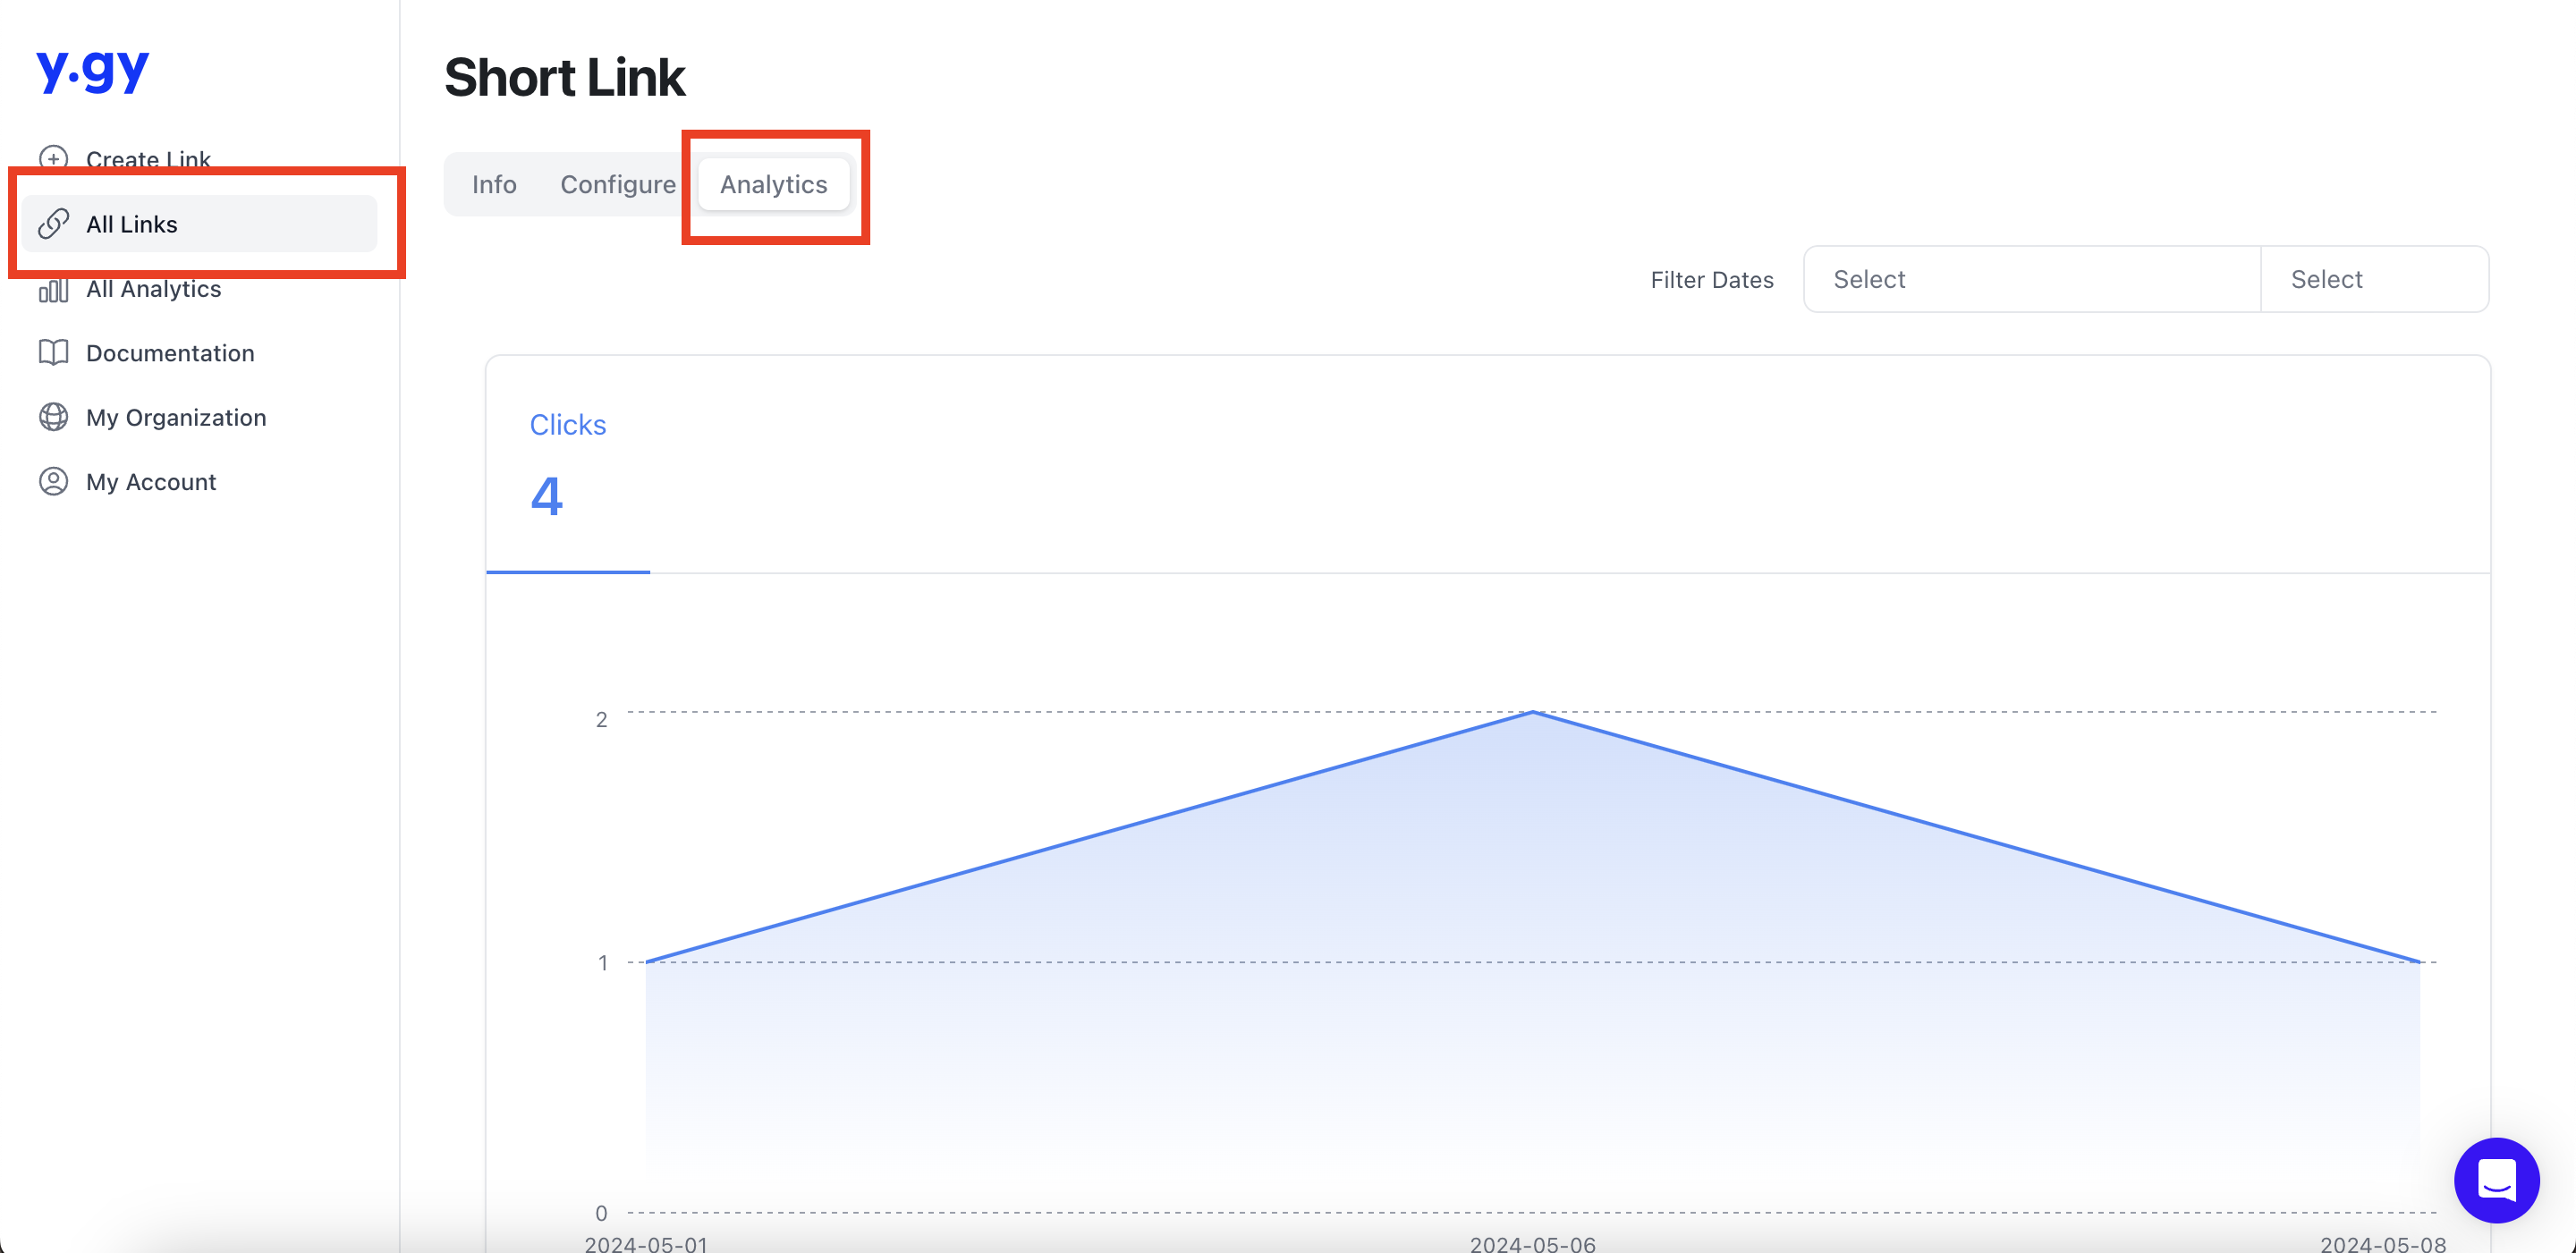
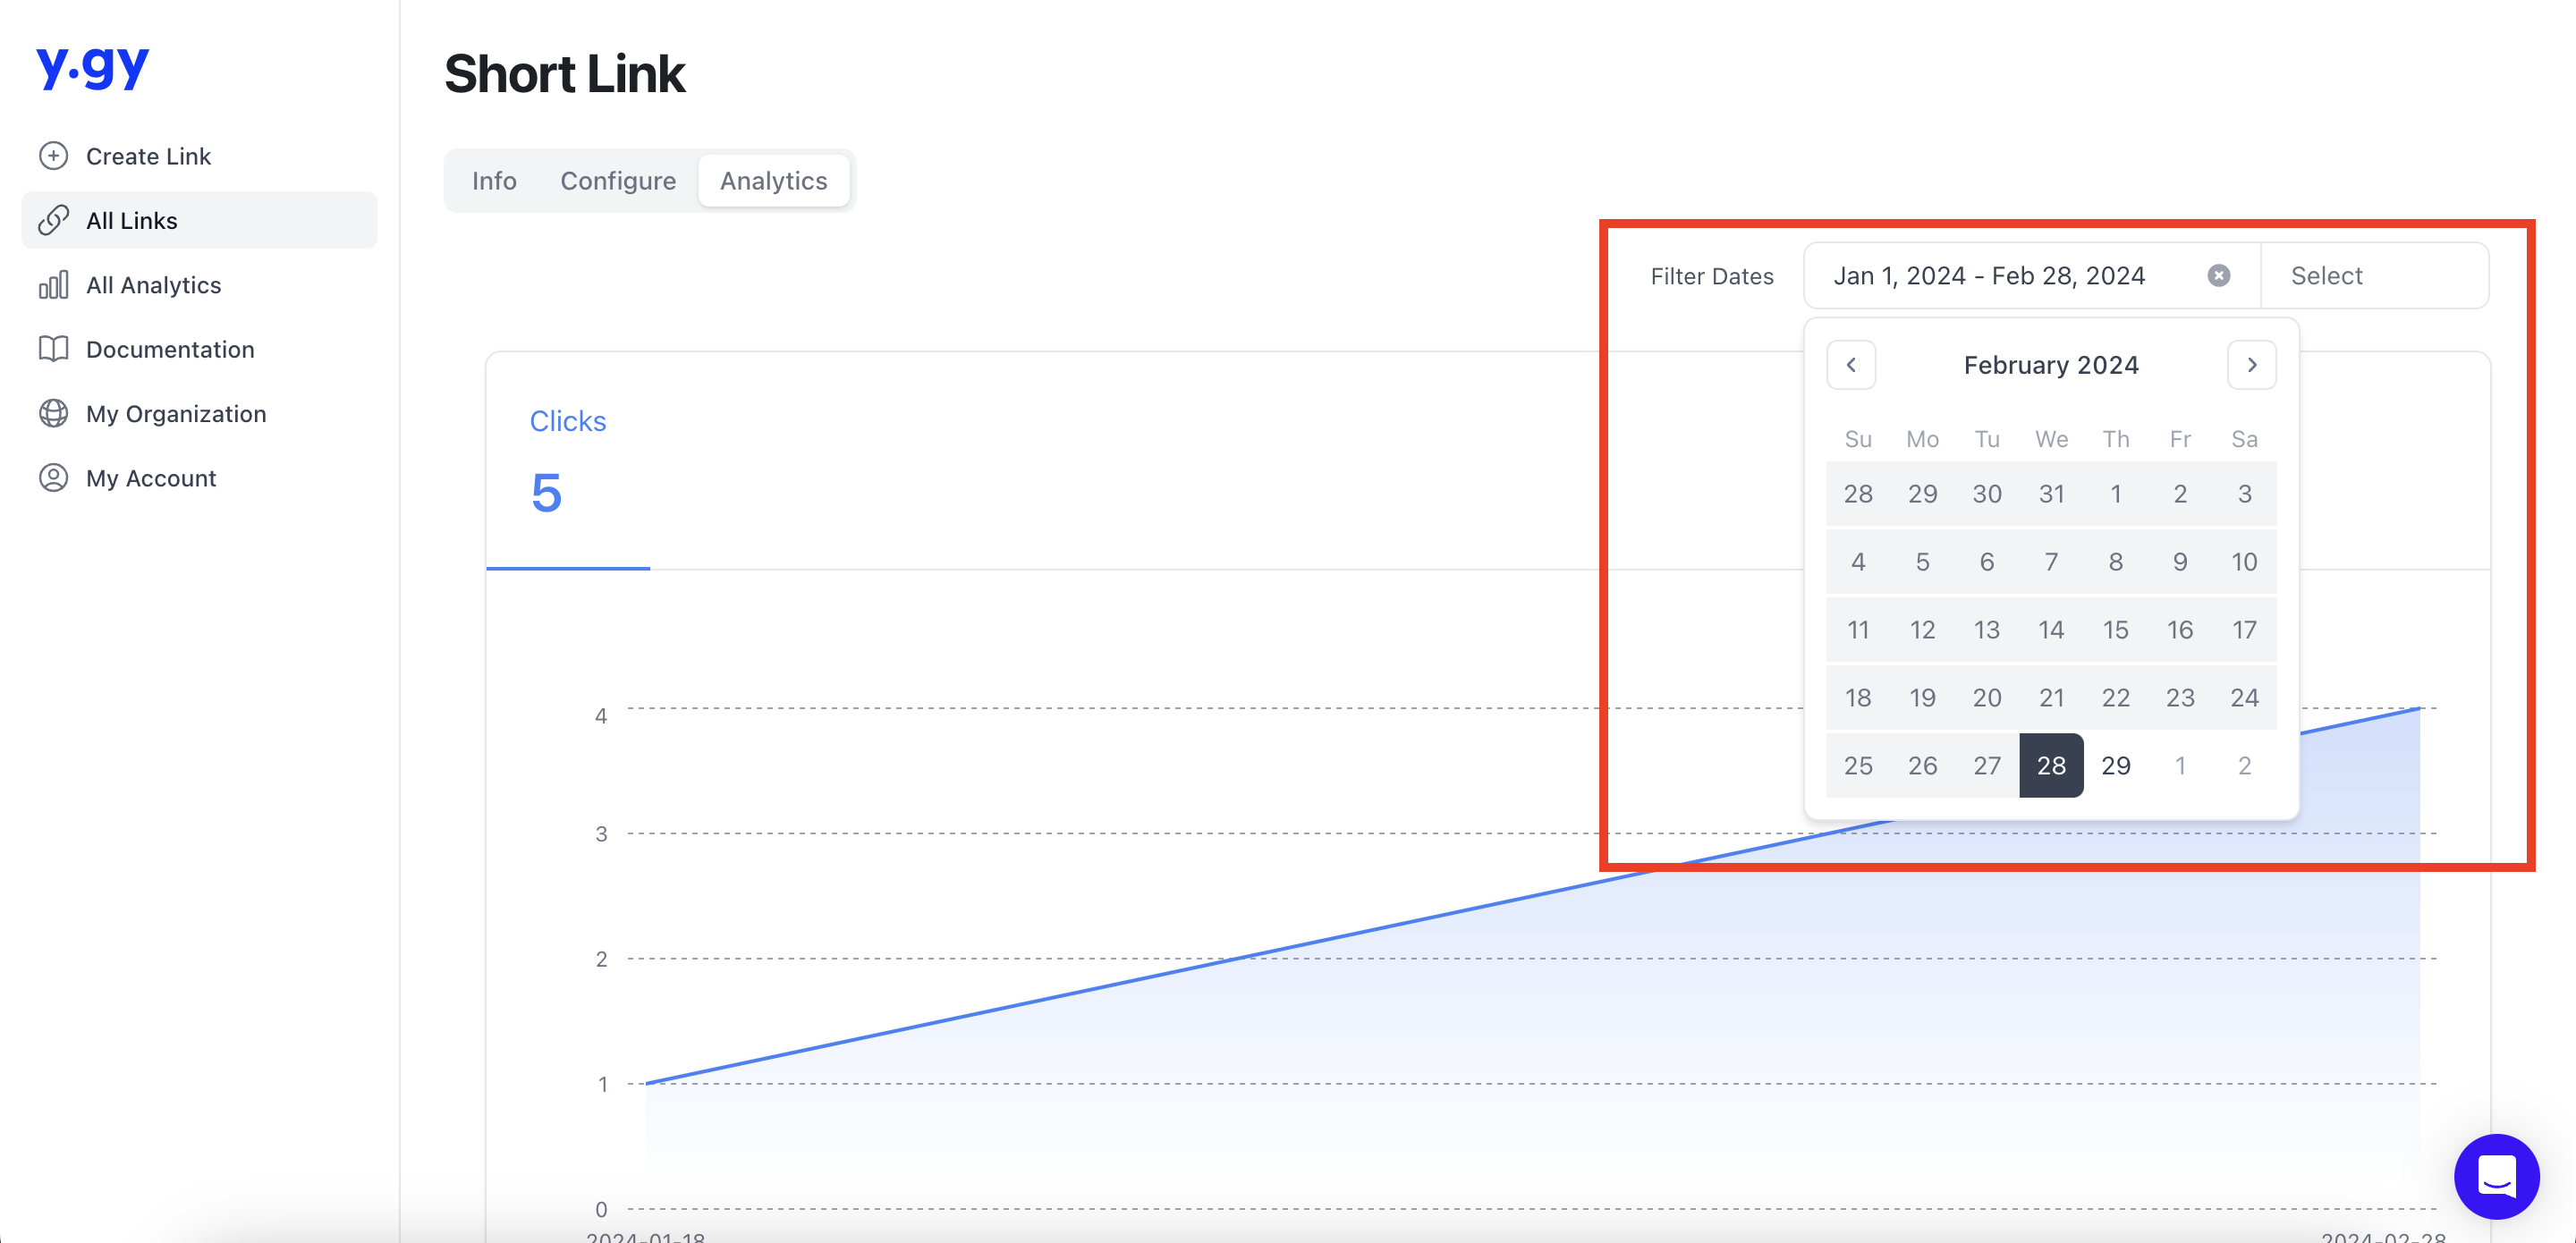
It will, by default, show analytics of the current year only; you can wish and toggle the date range using the Filter Dates Field.
Clicks
Our Total Clicks Line Chart offers a real-time visualization showcasing the evolution of clicks over time. Users can easily track trends, identify peak performance times, and pinpoint potential areas for improvement by analyzing the trajectory of clicks across various days.
Location
Our Location Bar Graph presents a comprehensive breakdown of click distribution based on geographical regions. Each bar on the graph represents the frequency of clicks originating from different locations, providing valuable insights into audience demographics and regional engagement patterns.
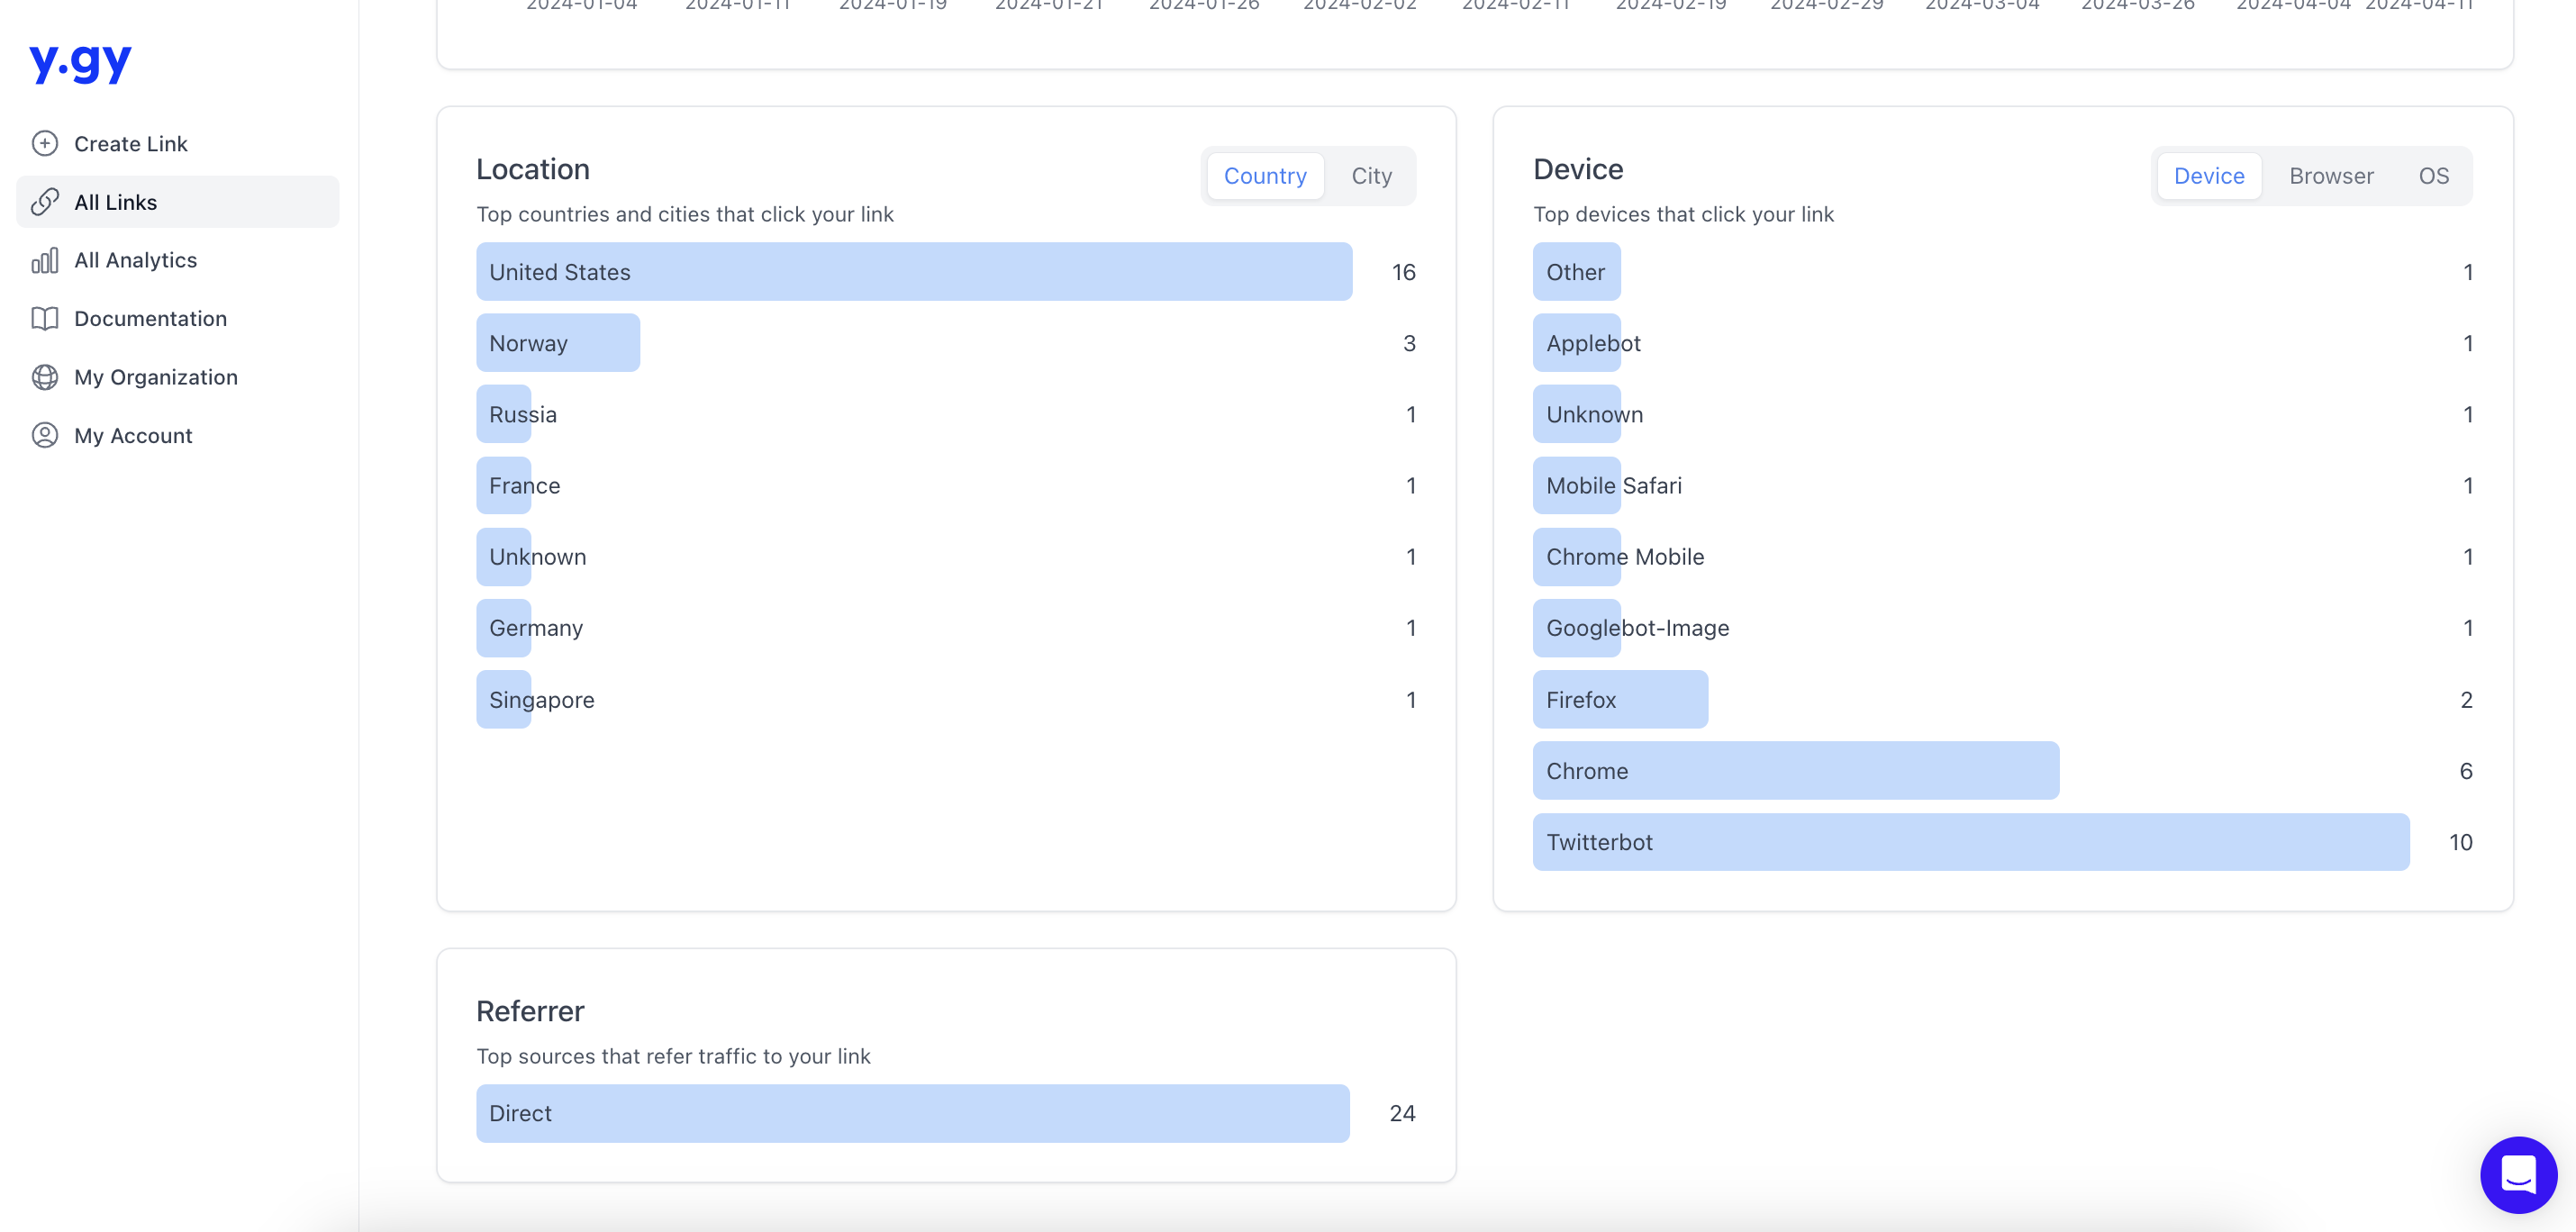
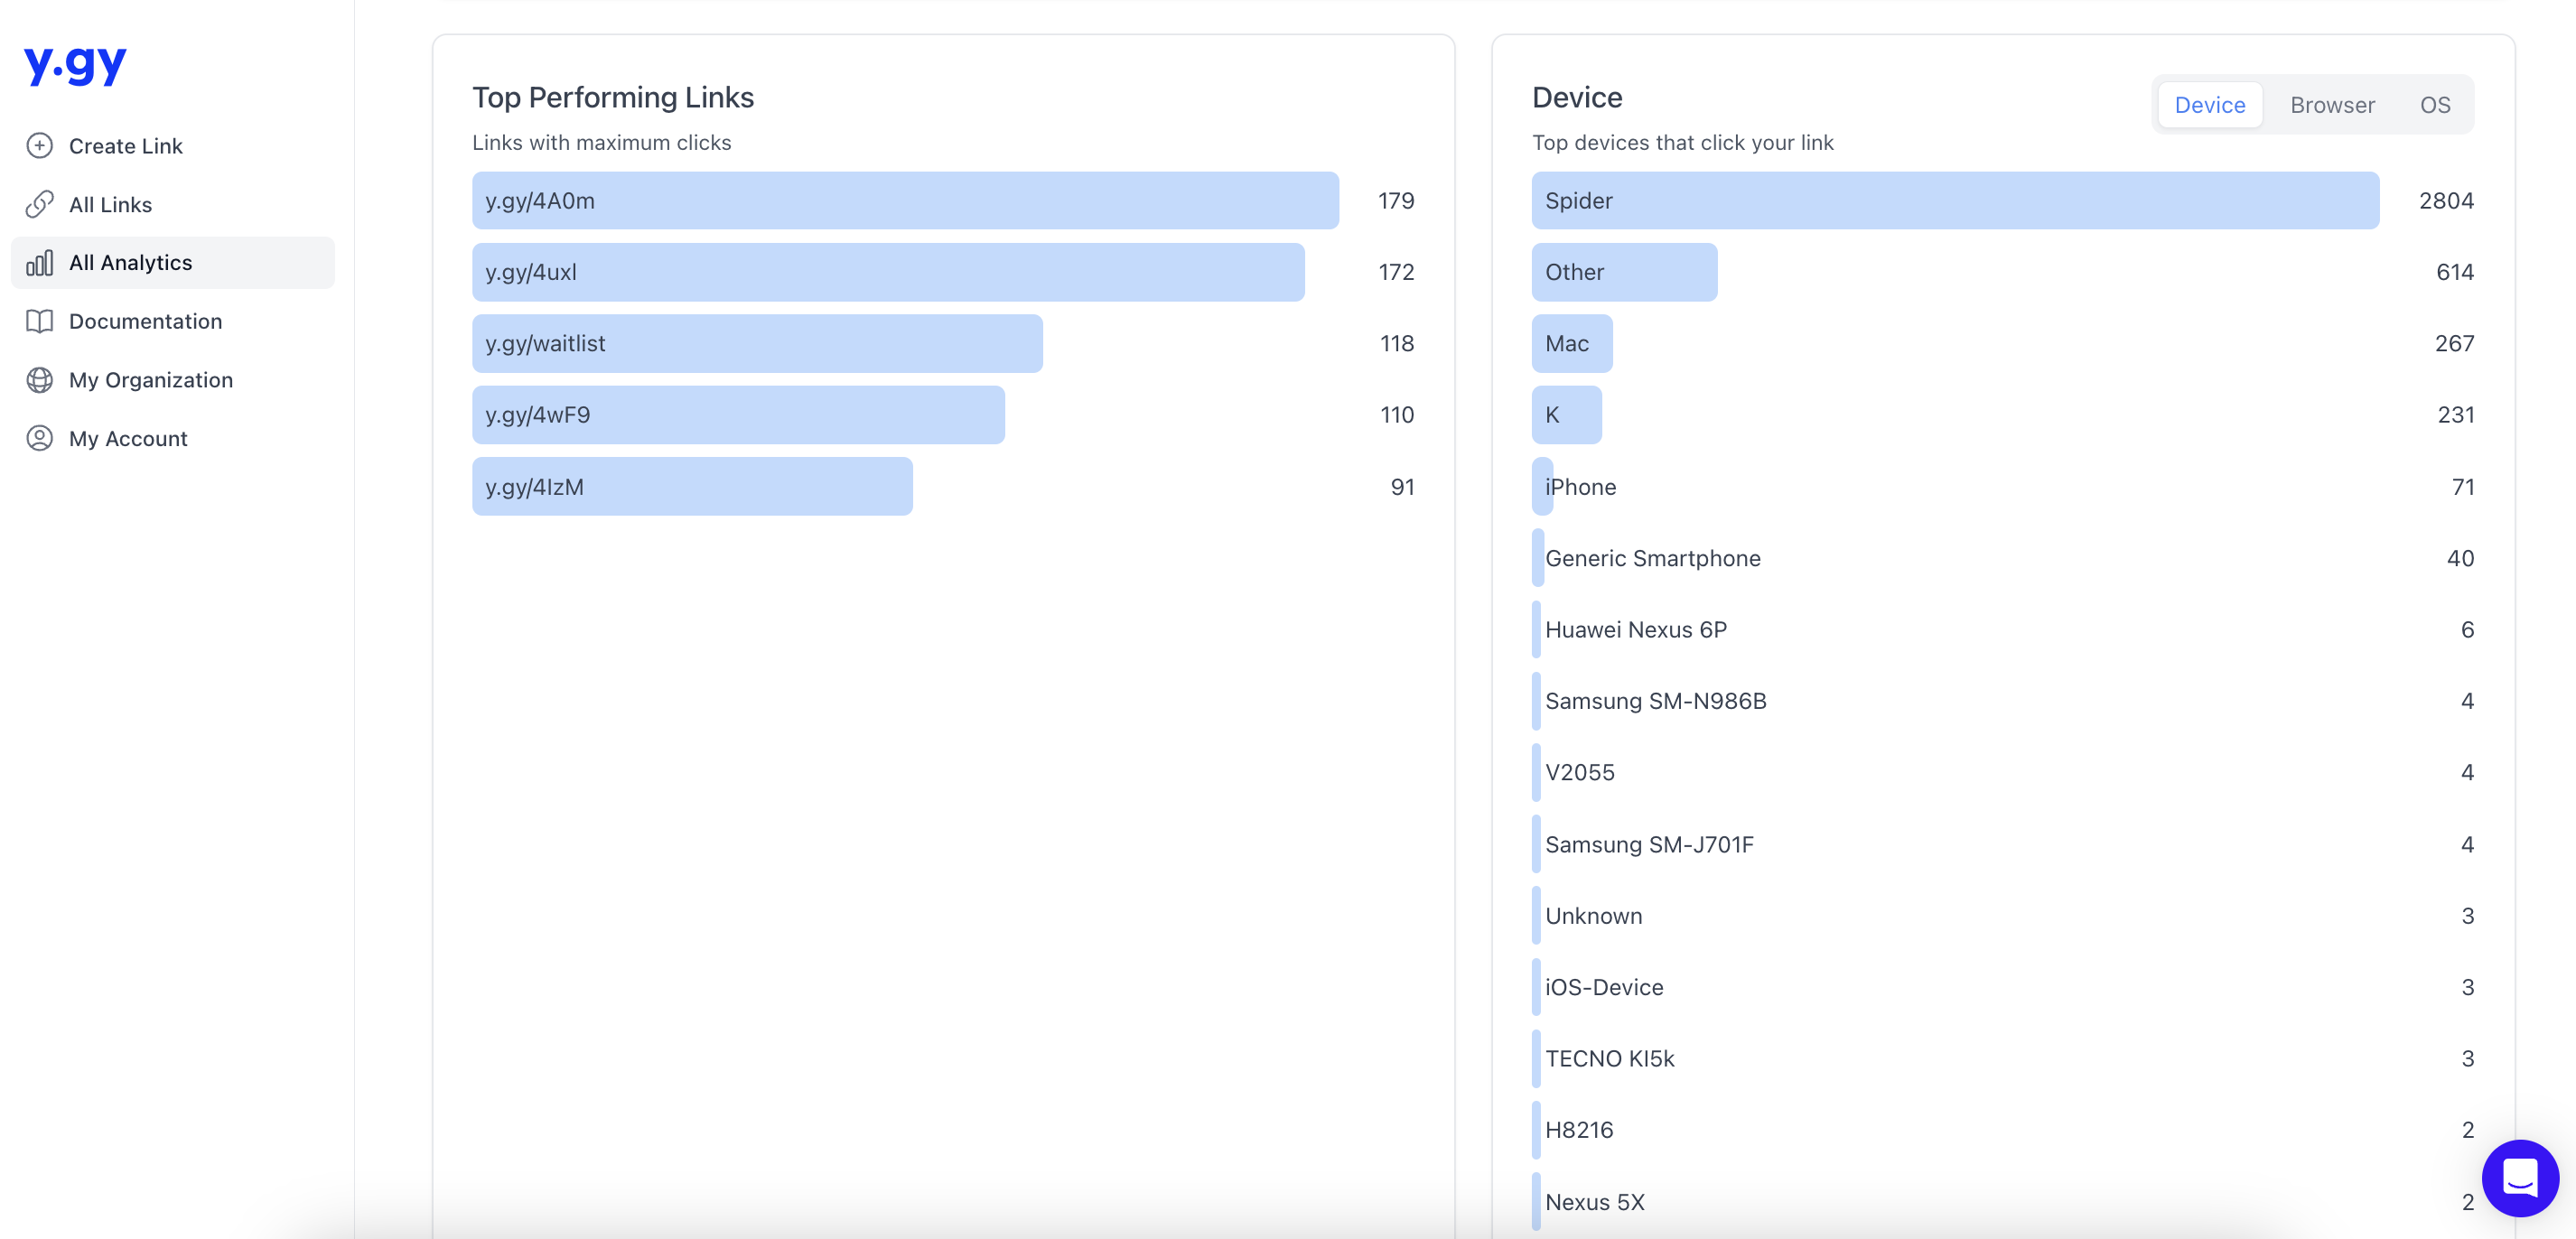
Device
Our Device Bar Graph offers a detailed overview of click distribution across various devices. Each bar on the graph illustrates the proportion of clicks generated from different devices, including desktops, laptops, smartphones, and tablets. This visual depiction allows users to discern the prevalence of device types among their audience, facilitating strategic optimizations tailored to specific device preferences.
Referrer
The referrer show the origin URLs of your traffic, be it from search engines, social media, or direct links. The Referrer Source is defined as the most recent website from which the user came before they viewed your Link.
All Analytics
You can access analytics at the organizational level from the "All Analytics" menu item.
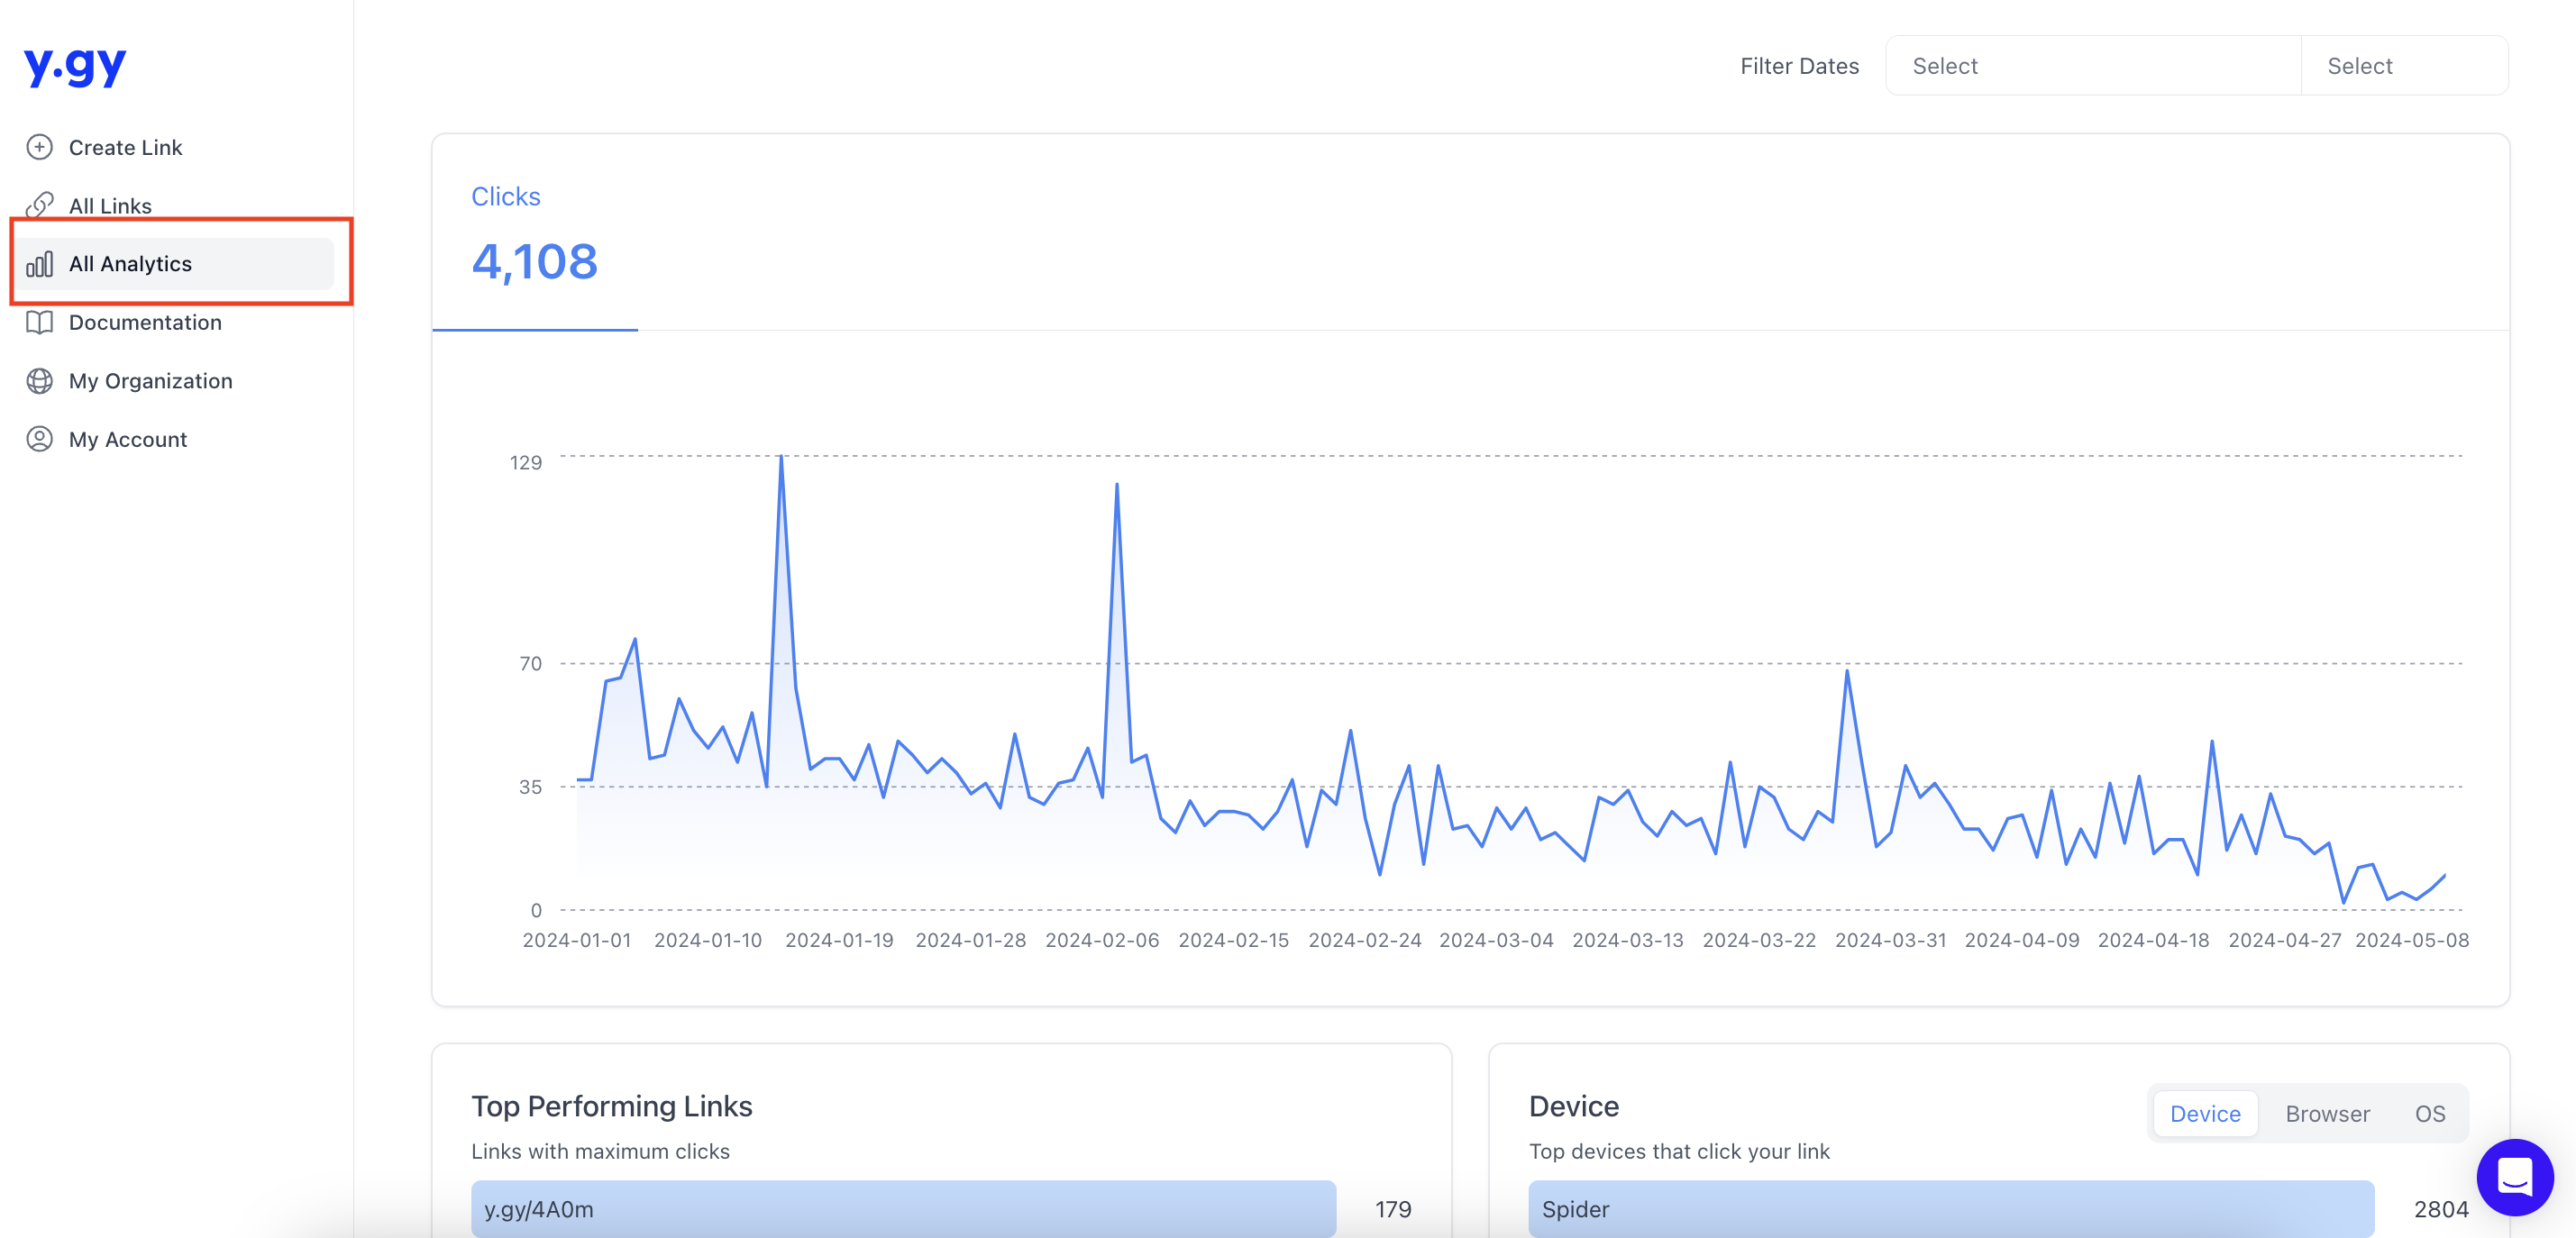
In addition to all the analytical charts and graphs that we have for individual links, "All analytics" has Top Performing Links Graph.
Top Performing Links
The Top Performing Links graph within the "All Analytics" section offers a concise summary of the most successful links across your organization. By prioritizing links based on their total clicks, this graph highlights the content that resonates most with your audience.
Why should you use analytics on y.gy?
Utilizing analytics on y.gy is essential for maximizing the effectiveness of your links and optimizing your online presence. By leveraging realtime insights into metrics such as click-through rates, geographical distribution, and device usage, users can gain a comprehensive understanding of their audience's behavior and preferences. This data-driven approach empowers informed decision-making, enabling users to refine marketing strategies, tailor content to specific audience segments, and identify opportunities for growth. Whether it's tracking the performance of individual links or gaining holistic insights at the organizational level, y.gy's analytics tools provide invaluable support for enhancing engagement, driving conversions, and ultimately achieving your digital objectives with precision and efficiency.